In this new series, let's analyze some of the top search terms of the month. Specifically, let's look at how many new content pieces were created,
This time we will be using Buzzsumo to look at one of the top trending keywords of May; SEO. Let’s look at what some of the stats say.

Overview
Looking at data between the weeks of April 30 – May 30, we can see that there were close to 26,000 engagements for just over 1,000 articles analyzed. In this day and age of immense content saturation, an average of 26 shares per post is very respectable. This might not seem like much at first glance but if you recall from our Content Marketing is Shifting in 2018 article, a study by Buzzsumo found that the average shares per post
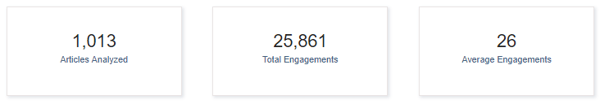
Now take 26 with a grain of salt, however, as one post from a thought leader that generates a high number of engagements could contribute to the rise in average shares per post. Factoring in the fact multiple thought leaders have written about SEO in the past month, the median number of engagements per post is probably much less than 26.
To test this we went back and filtered the results, this time excluding large industry players such as Moz.com and Searchengineland.com.
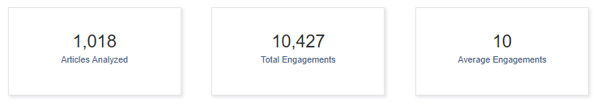
As we can see, the “new” average is 10, still over 2x the average. From
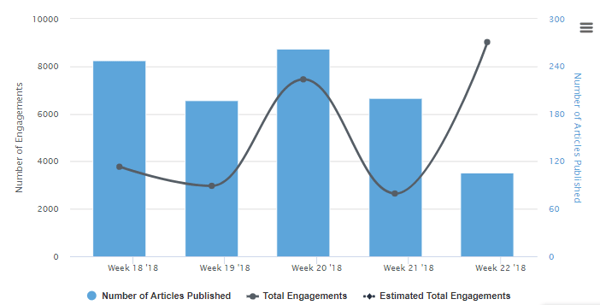
Total Engagements and Content Over Time
As we’ve previously mentioned, today’s online world is over saturated with content talking about the same subject or niche. Such content shock and repetition is oftentimes off-putting to consumers who either stop engaging with or completely ignore a plethora of content pieces. From the chart below, we can see that despite the published to engaged ratio not being ideal, it is still in a much healthier position when compared to other keywords and topics. This means that there is still significant interest in the subject and more often than not, content published is in fact value driven.
Note: If you look at Week 22 of 2018, you will notice that engagement far exceeds content published. This is another indication of a handful of posts from high authority creators bringing up the average.
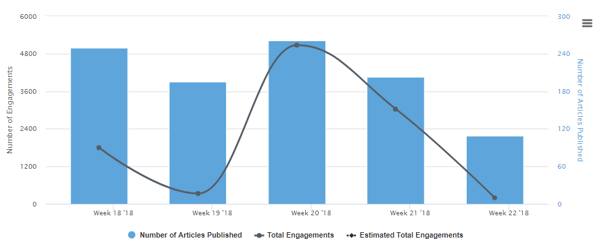
Again, after excluding the most influential industry players, the chart looks more like this:
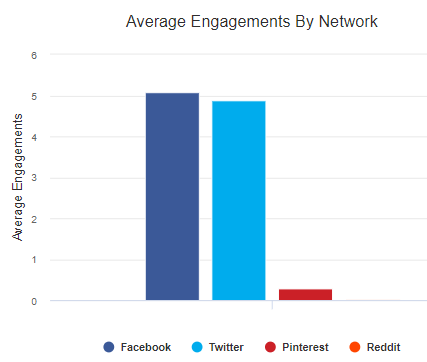
Average Engagement By Network
Interestingly enough, Facebook came out ahead as the preferred platform. However, as we will see in the next segment, Twitter had much greater diversity by post type.
Note: As of April, LinkedIn stopped displaying shares, so engagement for that platform cannot be measured. If you are considering publishing content around the subject of SEO, LinkedIn, along with their presentation sharing counterpart Slideshare, should not be overlooked.
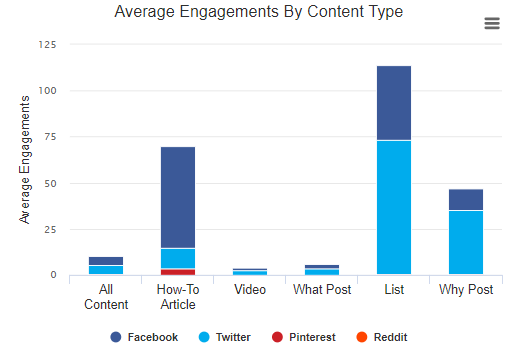
Average Engagement By Content Type
As we mentioned previously, Facebook might have the greatest amount of engagement for the term, but Twitter showed the greatest variety when it came to the type of posts being published and interacted with.
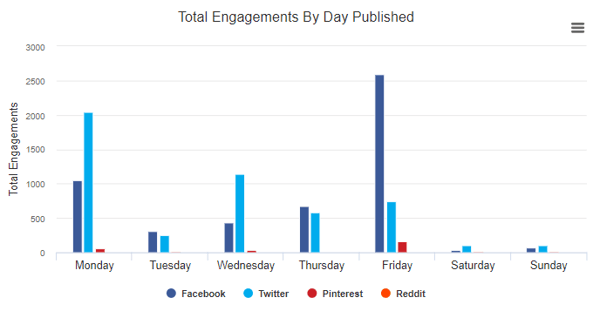
Total Engagements By Day
It would seem that the best times to post are closer to the beginning and end of the working week. Pay close attention to which social platforms perform the best during days of interest. While Facebook gets the highest amount of engagement on Tuesday, Thursday, and Friday; Twitter outperforms the rest of the week and shows greater consistency.
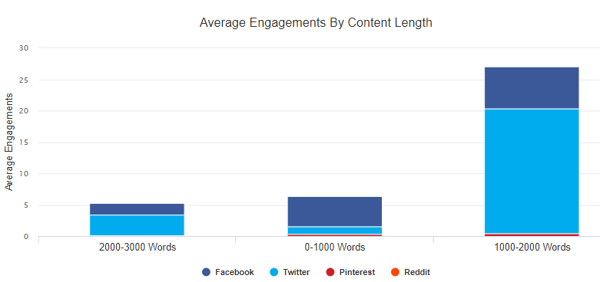
Amount Of Engagements By Content Length
The correlation between the size of content published and the platforms they are published on is a clear indicator of what the audience prefers. If you are planning on publishing on Twitter, be sure your content is rich and quality driven, reaching an average of between 1,000 and 3,000 words. On the other hand, content that is to be published on Facebook should be kept short and concise.
Having said that, that does not mean quality should be lessened. Focus on being able to condense as much quality content as you can in “bite-size” portions for your audiences. You can also consider multimedia pieces of content such as videos or infographics for this social platform.
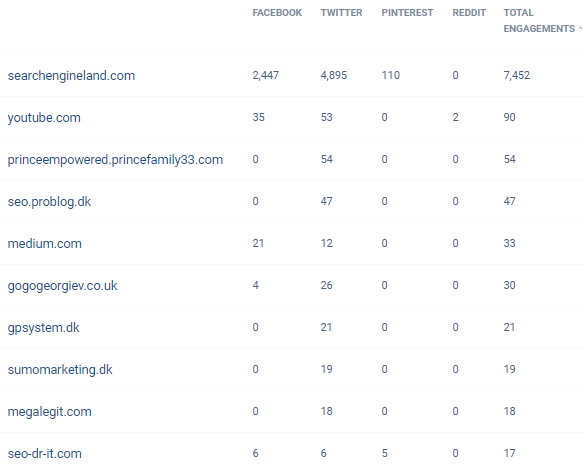
Top Engaged Domains By Network
If you are interested in which sites are performing the best for the term SEO, take a look at the table below. You might want to leverage this for backlinks, idea generation, relationship building, or simply to educate yourself with high-quality content from authoritative domains. For this segment, we did not filter out any large industry players.
Top Articles for You to Explore
If you want to learn more about SEO here are our top picks.
These posts were among the most engaged with content pieces published during May, and include some truly valuable insight regarding SEO.
- Beginner's Guide to SEO (Search Engine Optimization)
- How to Improve Website SEO Performance - SEO (Search Engine Optimization)
- Beyond keywords: What really matters in SEO content
- 10 Facts You Think You Know About SEO That Are Actually Myths
- 4 SEO Ideas You Overlooked That Will Skyrocket Your Rankings
- Search is more than Google: Mastering vertical search optimization
Do you have any questions? Is there a certain term you would like us to analyze next? Let us know!
And as always check out the links below for more digital marketing insight:
- The Art Of Repurposing Content
- 5 Steps to Make Influencer Marketing Work for You
- Content Marketing - What Does It Really Mean?
- 15 Types Of Blogs To Make Content Marketing More Effective