Regardless of the industry you're in, data is something no business can live without. Oftentimes, data goes without any context, which causes something so vital to a company’s success to be rendered completely useless.
Take the following image for instance:
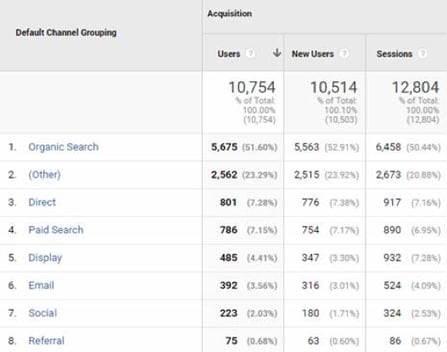
What do you see? You see data regarding sources of traffic, right? So what can you do with it…?
The answer here is absolutely nothing. There are just too many questions that need to be answered before this data can tell us anything, in other words, it needs context.
- What is this company’s objective? What are they striving to achieve?
- What kind of traffic do they want to be getting? Is it organic, paid, social?
- Where is this traffic coming from?
- Who is the audience, the source, the device?
- Where are these visitors located?
- Is the traffic coming from the correct audience?
- What is the time frame?
- Are these numbers reaching the goal? Are they falling short?
The list can go on.
So it’s extremely important to know what exactly you want to achieve, how you will achieve it, and during what time frame. All this gives your data the appropriate context so it can start to mean something, and ultimately be used to help you grow your business.
Understanding Raw Numbers
A great free tool for doing the above is Google Analytics. It’s ideal for:
- Setting end goals to monitor your progress
- Discovering important audience demographics
- Finding the sources of traffic to your campaign’s pages
- Tracking the devices used by your audience
- Gathering critical analytics for your data including KPIs such as Views, Pages Viewed, Number of Sessions, Duration of sessions, Bounce rate etc.
- Monitor audience behavior (flow from one page to the next)
- See how your site has performed during a given time period and compare it to the last
So now we’re set right? We have all the data we need. Well technically yes, and this is where many companies stop to analyze their data...but if you take a step back and think about it a bit more, you might see that something important is in fact missing. Everything above is from your perspective, but what about the perspective of your audience?
Providing Context to the Numbers
Basic KPIs such as Views, Clicks, and Lead Gen are all important data points to know and monitor, but they don’t tell the whole story. This is where other analytical tools, such as Lucky Orange come in.
Let’s say that you have an email campaign. You will monitor those who opened and read your email (Opens); those who clicked on your CTA (Clicks); and then those who filed out a form on your LP (Lead Conversion)
But what happens in between? What are visitors doing on your landing pages to affect this final number?
Lucky Orange can show us exactly how visitors are behaving on our site via its recordings feature and heat maps so we can ascertain what is (or isn’t) working for our page. In other words, you see how your audience interacts with your site, through their eyes.
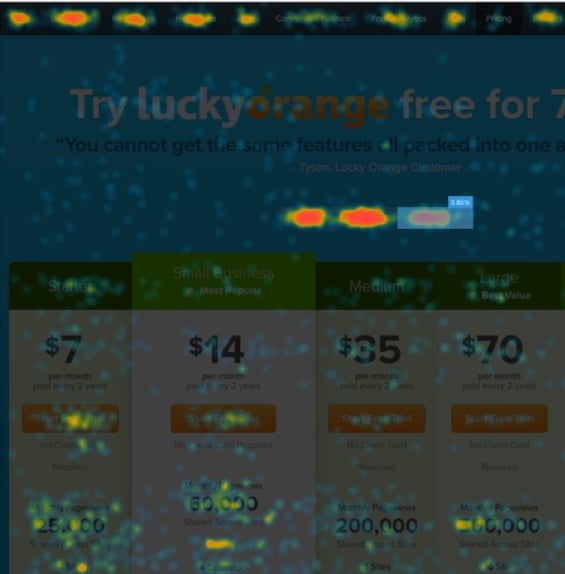
More specifically Lucky Orange can be used to:
- Record each session and see how each visitor interacted with your page (through their screen)
- See which parts of your page visitors are clicking and interacting with the most via heat maps
- Track your visitor’s mouse movements on your page
- See how long it took them to fill out your forms
- See if every element of your page is working as expected
This is another extremely potent tool for providing context to data. While it is unable to provide in depth analytical information regarding KPIs, it does an excellent job at showing the behavior behind those numbers. As such it should always be used as a supplement to analytical tools like GA in order to have the fullest image possible.
If you have any questions or enjoy our content, let us know in the comments below! And as always, feel free to follow us on LinkedIn and Twitter.